Plotting in Scilab is fairly simple when you know the commands and syntax.
Commands[]
Command for plotting
- plot()
Usage:
- plot(x,y,<LineSpec>,<GlobalProperty>)
Simple Plotting[]
Plotting a sin wave[]
| plot | |
|---|---|
Plotting two images on top of each other[]
| Code | Plot |
|---|---|
clf()
t=0:0.1:2*%pi;
y1=sin(t);
y2=sin(2*t);
y=[y1;y2];
plot(t,y)
or plot(t,y1) plot(t,y2) |
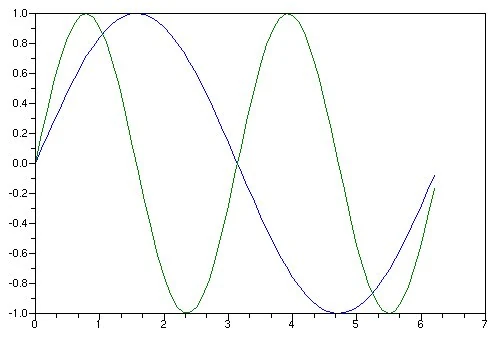 |
Making multiply plots in the same window[]
To make more than one plot in the same window you use the
- command
- subplot
- Usage
- subplot(<columns><rows><plot location>)
Example of 4 plots in the same window
| Code | Plot |
|---|---|
clf() t=0:0.1:2*%pi; y1=sin(t); y2=sin(2*t); y3=sin(4*t); y4=sin(8*t); subplot(221); plot(t,y1) subplot(222) plot(t,y2) subplot(223) plot(t,y3) subplot(224) plot(t,y4) |
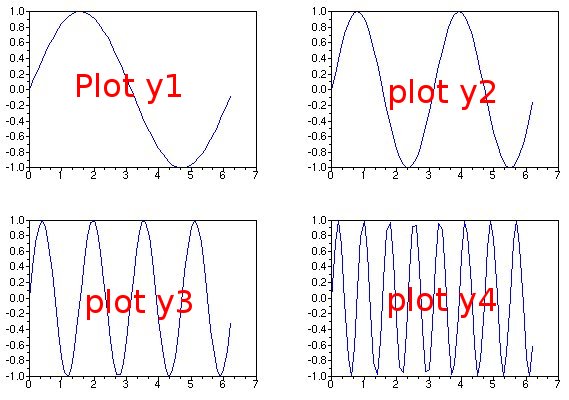 |
Labeling[]
- Command
- xtitle()
- Usage
- xtitle("<title>","<x-axis>","<y-axis>")
| Code | Plot |
|---|---|
clf()
t=0:0.1:2*%pi;
y=sin(t);
xtitle("this is the title","the x-axis","the y-axis")
plot(t,y)
|
 |
Line Appearance[]
Different Line styles, and colors
| Code | Plot |
|---|---|
clf() t=0:0.1:2*%pi; y=sin(t); plot(t,y,"o") |
  |
Line Style[]
| Specifier | Line Style |
|---|---|
|
- |
Solid line (default) |
|
-- |
Dashed line |
|
: |
Dotted line |
|
-. |
Dash-dotted line |
|
+ |
Plus sign |
|
o |
Circle |
|
* |
Asterisk |
|
. |
Point |
|
x |
Cross |
|
'square' or 's' |
Square |
|
'diamond' or 'd' |
Diamond |
|
^ |
Upward-pointing triangle |
|
v |
Downward-pointing triangle |
|
> |
Right-pointing triangle |
|
< |
Left-pointing triangle |
|
'pentagram' |
Five-pointed star (pentagram) |
Line Color[]
As an additional parameter, supply the SpecifierColor which can be:
r - Red g - Green b - Blue c - Cyan m - Magenta y - Yellow k - Black w - White
Multiply Windows[]
References[]
- --